Data & Insights Hub
The Black Families Flourishing Data & Insights Hub is designed to help community members, researchers, and policymakers better understand the population of Black families with children in the United States. The Hub brings together interactive maps (data) and interpretive summaries of these maps (insights) to support community- and state-level decision-making by showing how demographic and economic characteristics vary across geographic levels. Using publicly available Census data, it complements existing analyses of demographic data on the U.S. Black population by focusing on Black families with children.
We drew on 2019–2023 five-year American Community Survey microdata from IPUMS USA to better understand Black family households with children, a population that has not been highlighted to date. The data contain information on individuals, including householders, who self-identified as Black alone or in combination with other races and/or Latino ethnicity. We define Black family households as a family household that includes at least one child up to age 25, where either the youngest child in the household or a primary caregiver (i.e., biological parent, stepparent, adoptive parent, grandparent) is Black.1
| Count | Percentage | |
|---|---|---|
Data
The Data feature of the Hub includes interactive maps that allow users to explore county-level demographic information on Black family households with children. The following maps are included across four topical areas: 2
1. Geography
- Percent Black Family Households
2. Child Age
- Percent of Black Family Households with Children 0-5
- Percent of Black Family Households with Children 6-11
- Percent of Black Family Households with Children 12-17
- Percent of Black Family Households with Children 18-25
3. Family Structure
- Percent of Black Family Households with Multiple or Skip Generations
4. Family Income
- Average Income of Black Family Households
- Percent Income Difference, Black Family Households and All Family Households
- Average Income Difference, Black Family Households and State Median Income
- Average Income Difference, Black Family Households and County Median Income
Insights
The Insights feature of the Hub provides data points with brief interpretive summaries based on interactive data maps. Click the links below to read an introduction that will orient you to the Fresh Look Series and to access the data points themselves. As analyses continue, we will add additional data points highlighting other topical areas to the series.
- Introduction to the Fresh Look Series from the Black Families Flourishing Project
- A Fresh Look at Black Family Households with Children in the United States
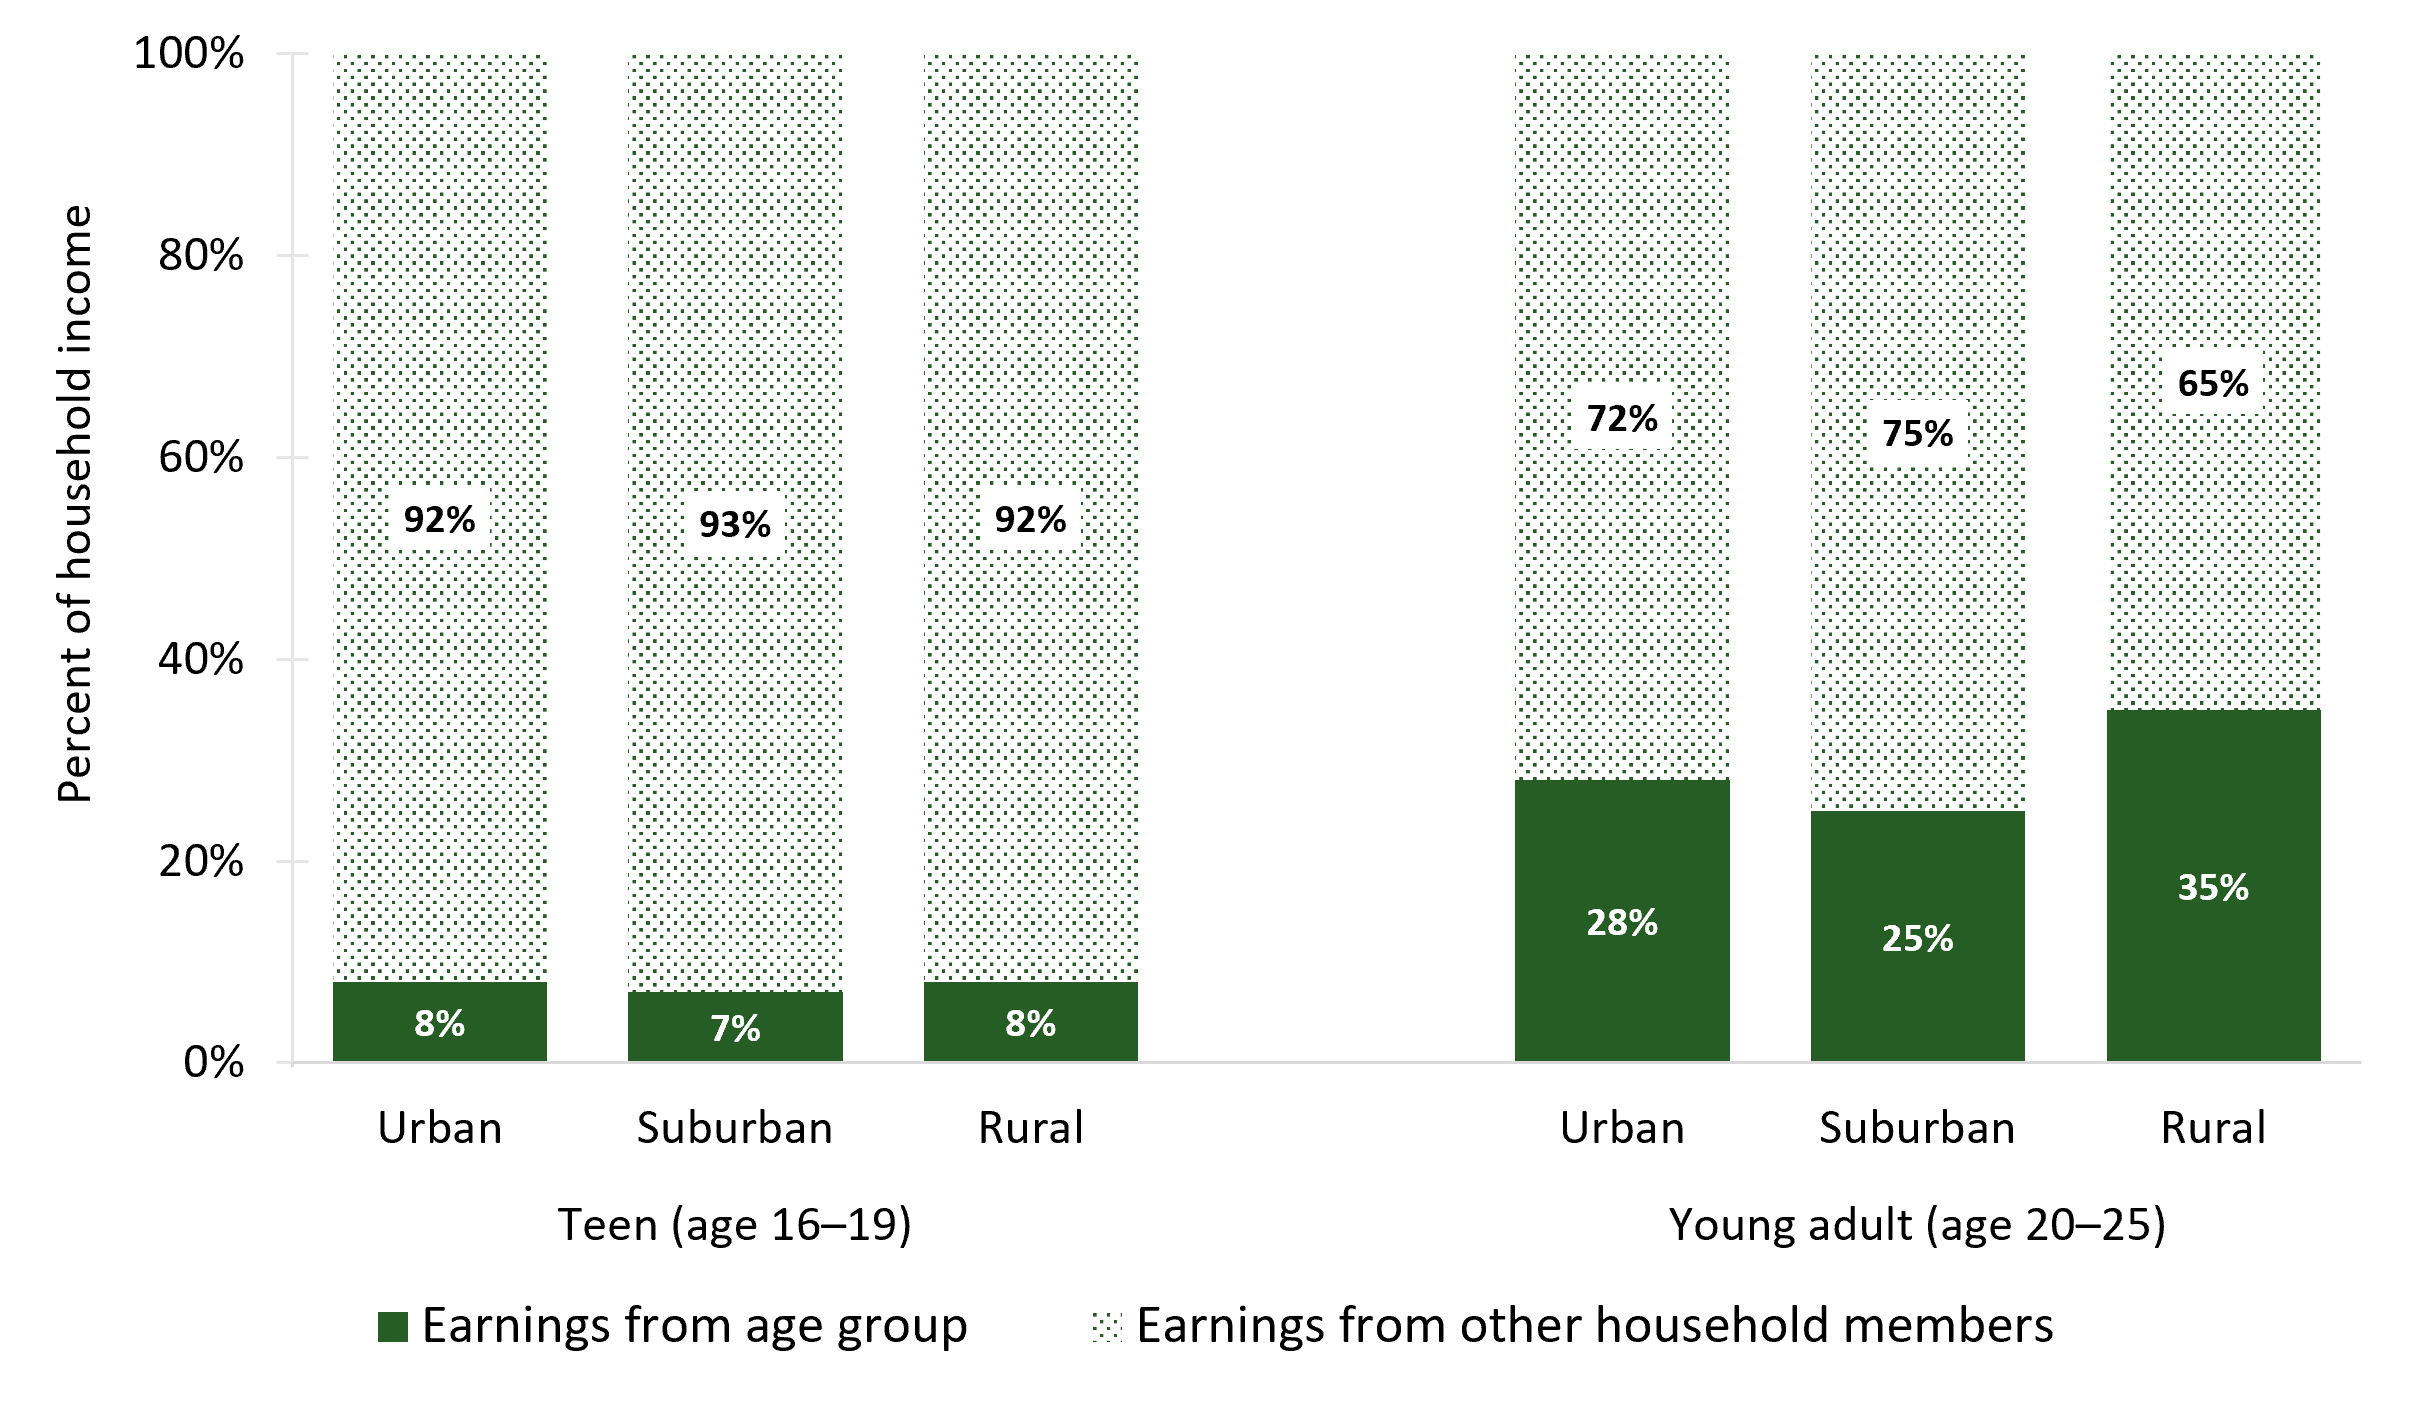
- A Fresh Look at Employment Among Teens and Young Adults in Black Family Households
- A Fresh Look at Black Family Structures in the United States
Suggested Citation
To cite the Black Families Flourishing data, please use the following format, including the name of the map cited and the retrieval date:
The Black Families Flourishing Data & Insights Hub. (2026). Percent Black family households [Map]. Black Families Flourishing Project. Retrieved February 1, 2026, from www.blackfamiliesflourishing.org/data-insights-hub/
To cite the data points in the Insights’ Fresh Look Series, please use the suggested citation at the end of each linked PDF above.
Acknowledgements
Special thanks to (in alphabetical order) Kenya Downing-Whittaker, Katy Falletta, Christina Padilla, Manica F. Ramos, Zakia Redd, Yosmary Rodriguez, Sara Shaw, Ria Shelton, and Rebecca Vivrette for their review of and input on the Hub.
Footnotes
- In the households where at least one parent is present, we coded the household as Black when either the youngest child or a parent/the parents are Black. In the households where parents are not present, we coded the household as Black when either the youngest child or a grandparent/the grandparents are Black. In other words, grandparents’ races were only considered in households without parents. We excluded households that included children without a caregiver (e.g., a 25-year-old person living on their own) and children in households with their spouses without their own children or caregivers (e.g., 20-year-old person with their partner). ↩︎
- Additional topical areas may be added in response to user feedback and interest. ↩︎
Data Hub Author Contributions
The development of the Data & Insights Hub was led by Katie Richards (Conceptualization, Methodology, Formal Analysis, Writing – Original Draft, Software, Visualization, Project Administration), Shana E. Rochester (Conceptualization, Formal Analysis, Writing – Original Draft, Project Administration), Quiana Lewis Wallace (Conceptualization, Formal Analysis, Writing – Review & Editing), Yuko Yadastsu-Ekyalongo (Methodology, Formal Analysis), Chrishana M. Lloyd (Conceptualization, Methodology, Formal Analysis, Writing – Review & Editing, Funding Acquisition, Supervision), and Weilin Li (Visualization, Validation) of the Black Family Flourishing research team at Child Trends. The contribution categories described above are based on the CRediT author statement retrieved from https://www.elsevier.com/researcher/author/policies-and-guidelines/credit-author-statement. ↩︎
Invest in Our Work
We collaborate with individuals and organizations that share our values and commitment to Black families. Complete the form below to learn more about investment opportunities.